LoadRunner Controller
This is my second post from the HP LoadRunner series. As I discussed earlier, here I will be discussing an overview of LoadRunner Controller. So before going into detail, let me recap the prerequisites.
Create script – Checked
Replay Script – Checked
Updating script if required (Add transaction, Parameterization and Content Check) – Checked
Runtime settings and Iterations – Checked
Assuming the script is absolutely fine i.e. error free and ready to be passed on Controller, let us get familiar with the UI first. I will be using LoadRunner 9.5, the screens may vary at your end depending on the version you are using.
The UI
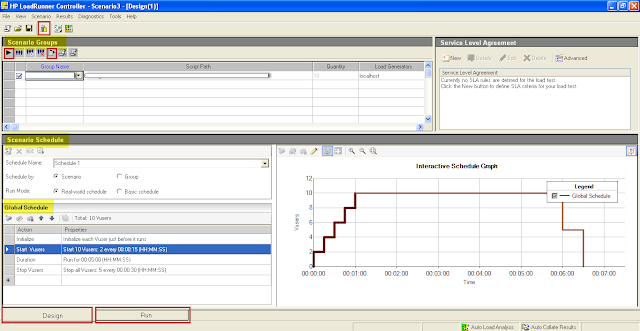
The Controller has a Title bar, Menu bar, tool bar and a Status bar. After these we have multiple sections or panes.
 The first is Scenario Groups pane. We can add multiple scripts or a single script and name them as a Group.
Next is Scenario schedule, here we define how the load will be passed and executed. We have two types of scenario group. Manual Scenario, Goal oriented scenario. Manual scenario is totally controlled by a user i.e. the execution and planning whereas a goal oriented scenario is executed on system defined settings.
The controller is divided in two tabs, Design View (displays scenario groups, Vuser configuration, load generators etc) and Run view (displays Vuser execution details and real time monitoring graphs)
Creating new scenario
Prerequisite: Script should be made and replayed successfully without any errors.
Step 1: Open Controller, you will see a Create New scenario pop up by default on opening the Controller. Select scenario type, browse or add the script, and click on Ok button. Update the schedule as per your required scenario.
Step 2: Now connect the load generator agents. Click on the Load generator agent displayed below the menu bar. Alternatively you can go click on the menu item Scenario > Load Generator. A pop up will be displayed, click on the connect button, or click on Add button to add more agents.
Step 3: Check run time settings. These are the same settings as defined in the previous post over VuGen. Update them as per your requirements.
Step 4: Execute the scenario. Click on the play icon in the Design view tab or the start scenario button in the run view tab.
Real time monitoring
While the controller is busy generating load on your application, you can have a real time monitoring of how it is being done. Scenario group pane displays current Vuser state i.e. Down, Pending, Ready, Running etc. Scenario status pane displays transaction / scenario summary.
Below these panes are some graphs. You can add any of the required graphs just by dragging the required graph and dropping them on the graphs area.
You can also view systems performance or windows resources. Right click and select Add measurement. A pop up will be displayed. Click on Add button, provide the name of the load agent, if you are generating load from your own system, write localhost, select the operating system and click on Ok button.
Click on Vuser button will display Vuser status. To see what actions are being performed by the Vuser, click on the details icon. It will display a pop up same as it gets displayed in the VuGen.
You can also add more users while a scenario is in progress. Click on the ‘Run/Stop Vuser’ button. Provide number of required users in the # column and click on Run or Init button as per requirements.
When the scenario finishes, it will open Analysis component only if you have configured. Or you may see the results manually. The scenario is saved with the ‘.lrs’ extension. So this was a quick overview from my side. There are a lot other options to explore. Give a try and start your load testing.
Note: Any changes done into the script or run time settings will not reflect it in the Controller, once added, to update you should use the Refresh button. Select the script group, click on the Details icon, click on the Refresh button > Script or run time settings, whatever needs to be updated.
Good to do: Check on the Auto Load Analysis and Auto Collate Results to automatically launch the results i.e. Analysis component. Go to Results item in the menu bar, click on the defined items.
Create script – Checked
Replay Script – Checked
Updating script if required (Add transaction, Parameterization and Content Check) – Checked
Runtime settings and Iterations – Checked
Assuming the script is absolutely fine i.e. error free and ready to be passed on Controller, let us get familiar with the UI first. I will be using LoadRunner 9.5, the screens may vary at your end depending on the version you are using.
The UI
The Controller has a Title bar, Menu bar, tool bar and a Status bar. After these we have multiple sections or panes.
 The first is Scenario Groups pane. We can add multiple scripts or a single script and name them as a Group.
 Next is Scenario schedule, here we define how the load will be passed and executed. We have two types of scenario group. Manual Scenario, Goal oriented scenario. Manual scenario is totally controlled by a user i.e. the execution and planning whereas a goal oriented scenario is executed on system defined settings.
The controller is divided in two tabs, Design View (displays scenario groups, Vuser configuration, load generators etc) and Run view (displays Vuser execution details and real time monitoring graphs)
Creating new scenario
Prerequisite: Script should be made and replayed successfully without any errors.
Step 1: Open Controller, you will see a Create New scenario pop up by default on opening the Controller. Select scenario type, browse or add the script, and click on Ok button. Update the schedule as per your required scenario.
Step 2: Now connect the load generator agents. Click on the Load generator agent displayed below the menu bar. Alternatively you can go click on the menu item Scenario > Load Generator. A pop up will be displayed, click on the connect button, or click on Add button to add more agents.
Step 3: Check run time settings. These are the same settings as defined in the previous post over VuGen. Update them as per your requirements.
Step 4: Execute the scenario. Click on the play icon in the Design view tab or the start scenario button in the run view tab.
Real time monitoring
While the controller is busy generating load on your application, you can have a real time monitoring of how it is being done. Scenario group pane displays current Vuser state i.e. Down, Pending, Ready, Running etc. Scenario status pane displays transaction / scenario summary.
Below these panes are some graphs. You can add any of the required graphs just by dragging the required graph and dropping them on the graphs area.
You can also view systems performance or windows resources. Right click and select Add measurement. A pop up will be displayed. Click on Add button, provide the name of the load agent, if you are generating load from your own system, write localhost, select the operating system and click on Ok button.
Click on Vuser button will display Vuser status. To see what actions are being performed by the Vuser, click on the details icon. It will display a pop up same as it gets displayed in the VuGen.
You can also add more users while a scenario is in progress. Click on the ‘Run/Stop Vuser’ button. Provide number of required users in the # column and click on Run or Init button as per requirements.
When the scenario finishes, it will open Analysis component only if you have configured. Or you may see the results manually. The scenario is saved with the ‘.lrs’ extension. So this was a quick overview from my side. There are a lot other options to explore. Give a try and start your load testing.
Note: Any changes done into the script or run time settings will not reflect it in the Controller, once added, to update you should use the Refresh button. Select the script group, click on the Details icon, click on the Refresh button > Script or run time settings, whatever needs to be updated.
Good to do: Check on the Auto Load Analysis and Auto Collate Results to automatically launch the results i.e. Analysis component. Go to Results item in the menu bar, click on the defined items.


Comments
Post a Comment